
The Network Status page shows whether our services are running right now, how reliable they were over the past year and whether maintenance is coming up. With the Your connection test you can also check how good your line to our data center in Vienna is.
Opening the status page
Click Network Status at the top of the Client Area or go to /serverstatus. You do not need to log in – the page also works when you cannot sign in at the moment.
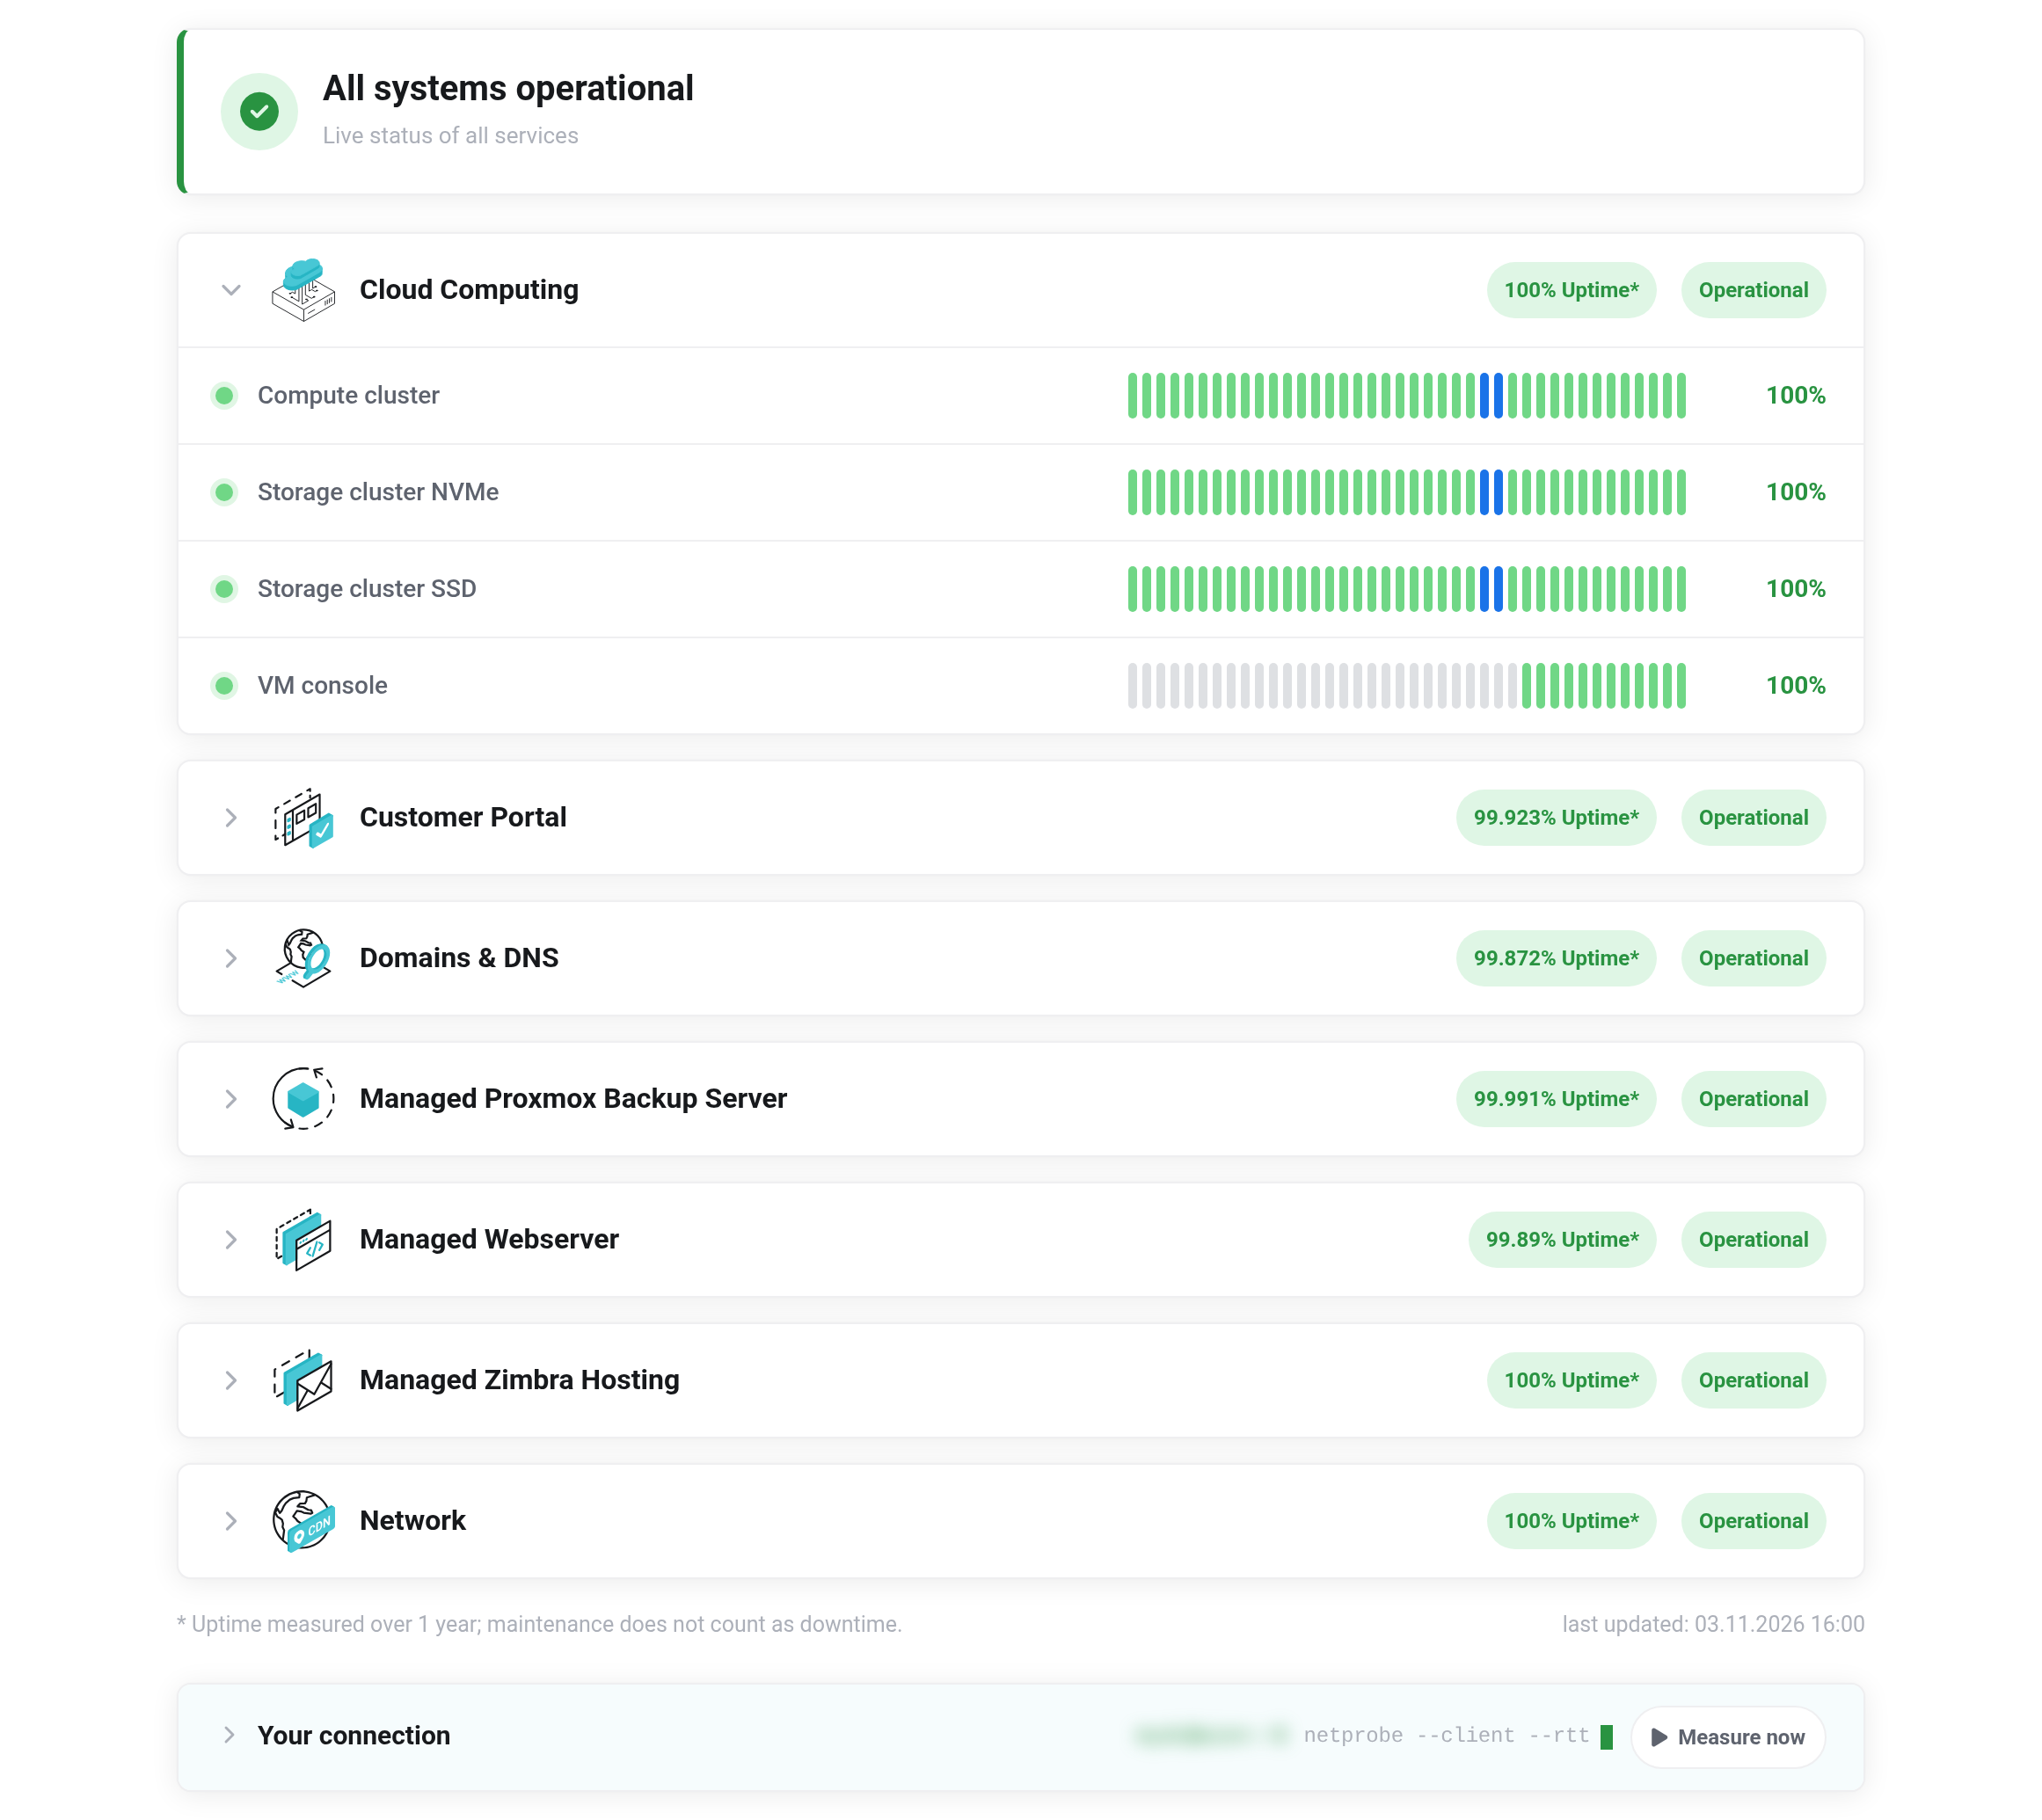
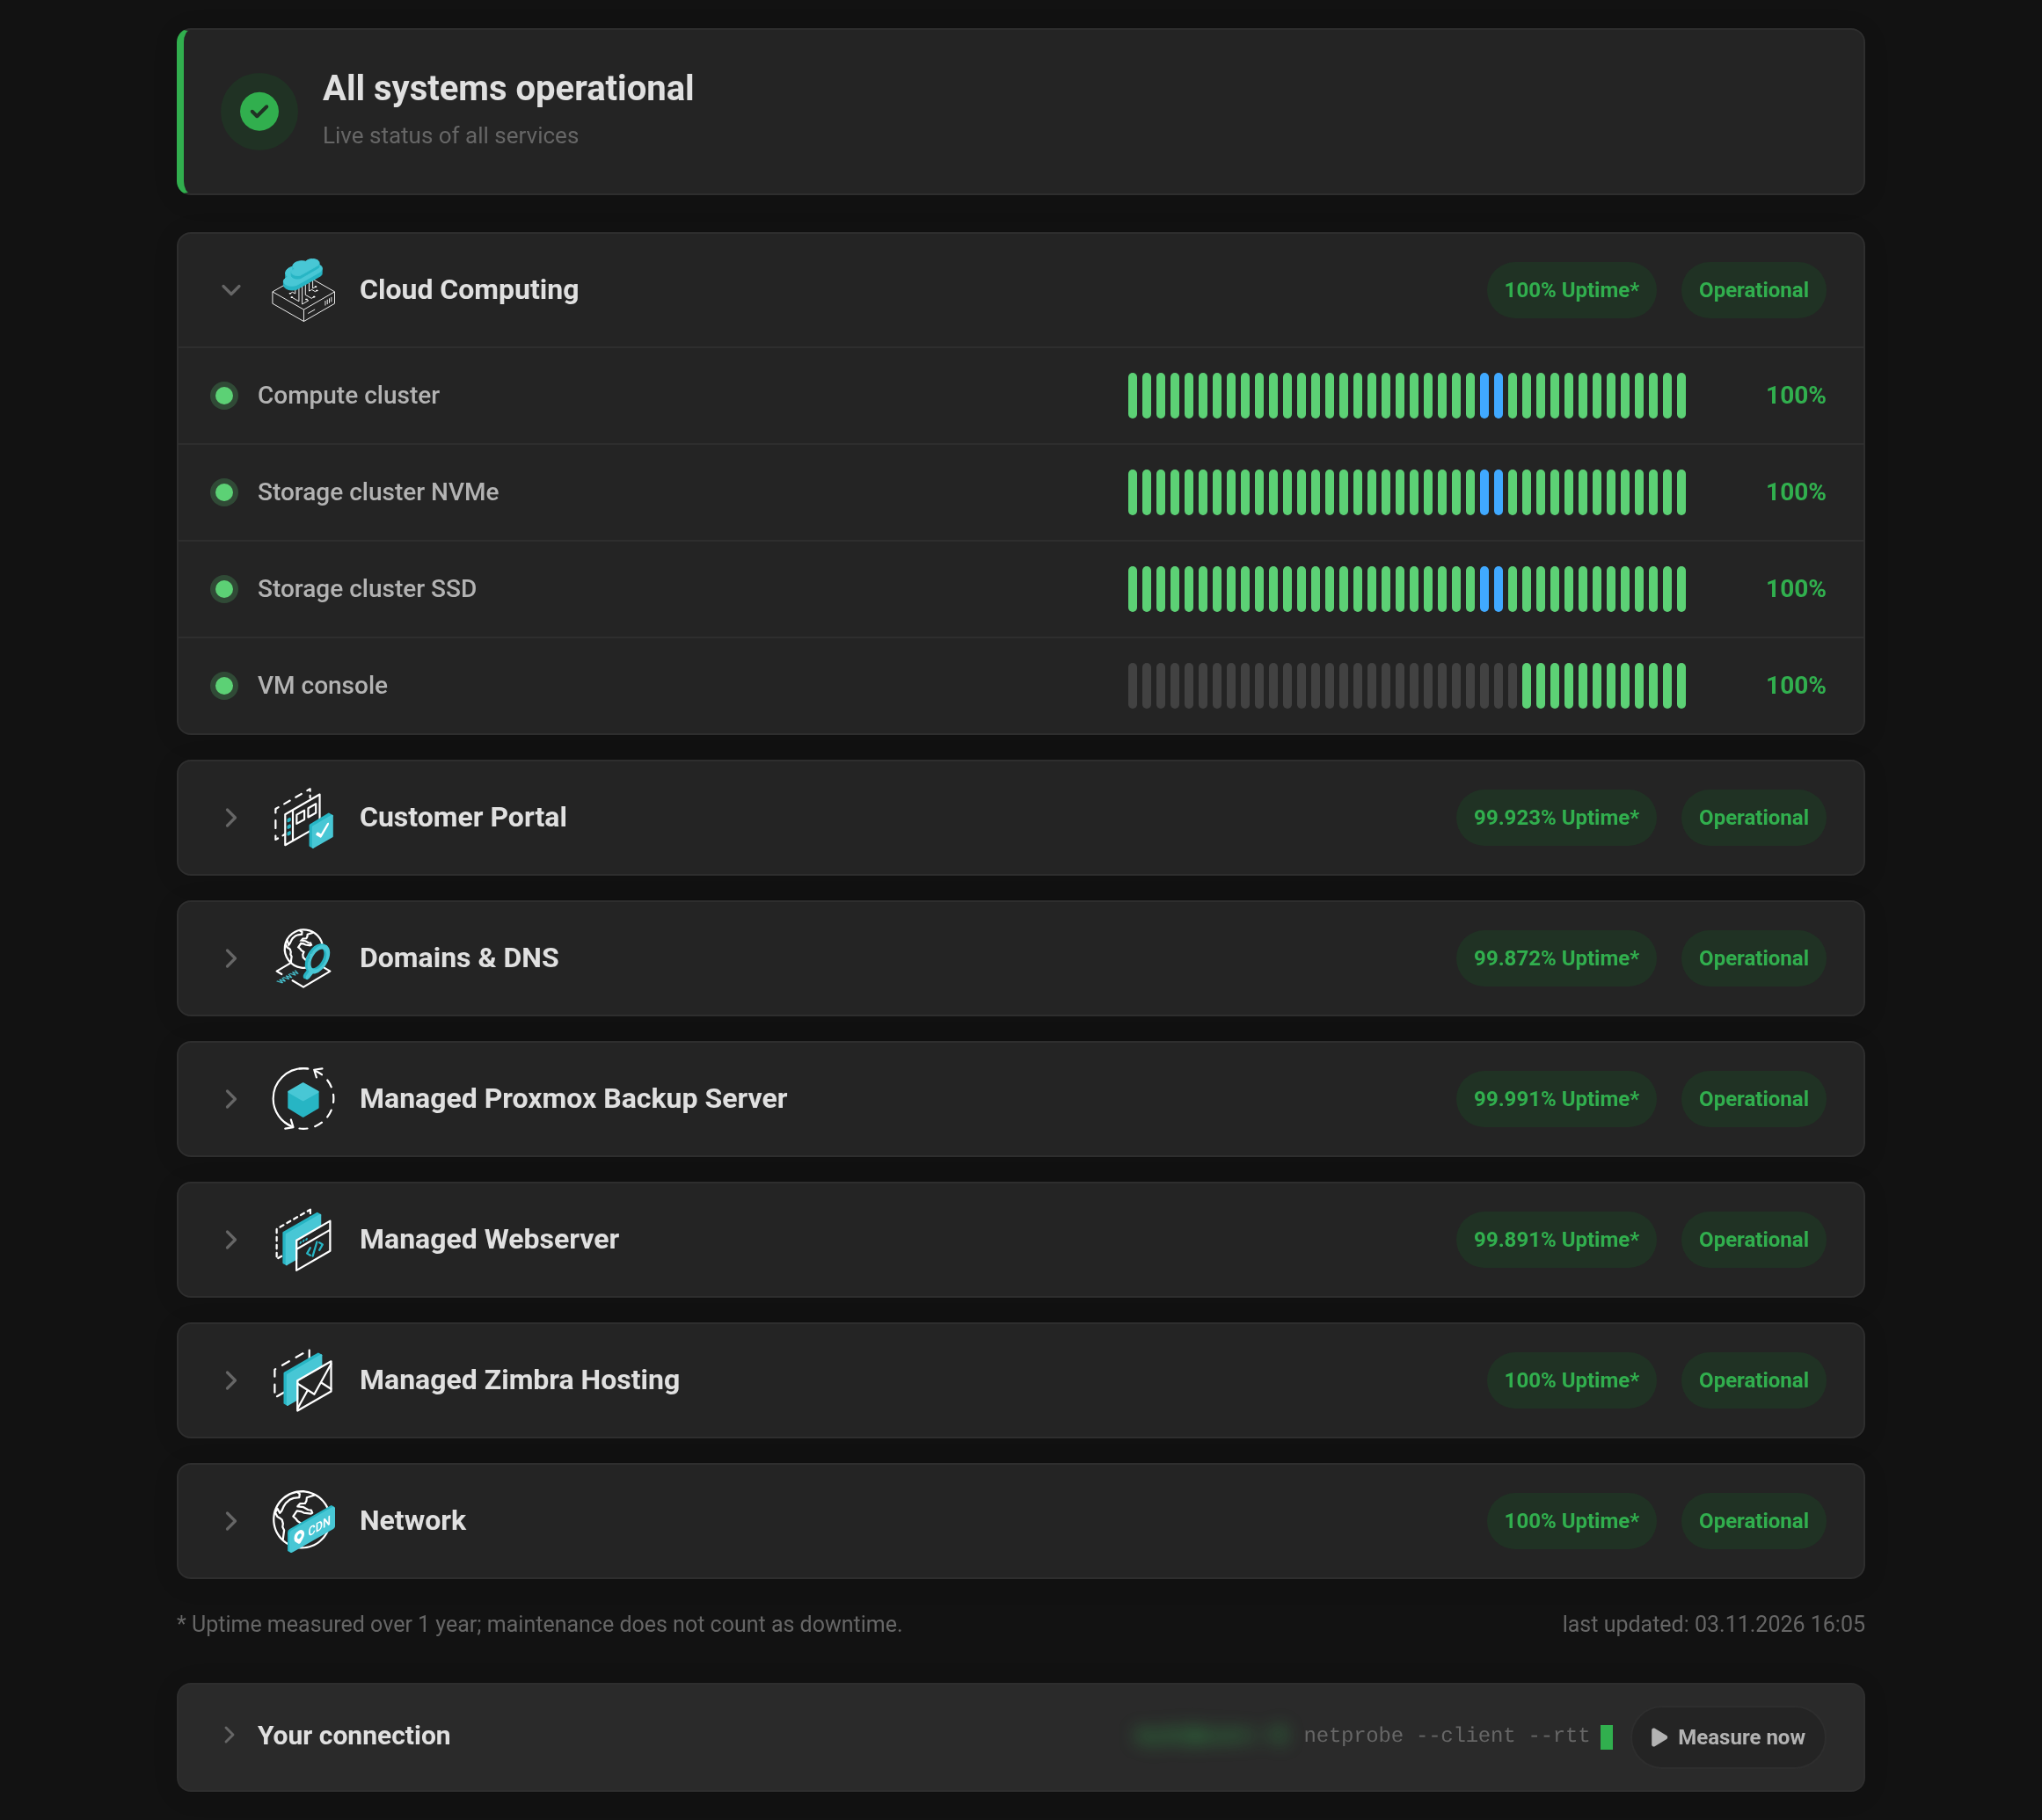 The overall state at the top, the groups below. The Cloud Computing group is expanded.
What the page shows
- Overall state
- At the very top, for example All systems operational, Partial degradation, Active outage or Under maintenance.
- Groups
- One row per service area, such as Cloud Computing, Customer Portal, Domains & DNS or Network. On the right you see the uptime – the share of time the area was running – and the current state: Operational, Degraded, Outage or Maintenance.
- Individual parts
- Clicking a group expands it. You then see its parts – for Cloud Computing, for example, the compute cluster, the storage clusters and the VM console. The bars show the history: green for operational, blue for maintenance, gray for periods without measurements.
- Current notices
- If there is an outage or announced maintenance, it is listed below with a description.
What “maintenance” means
Maintenance is work we plan and announce – updates to the platform, for example. During that time a service may be unavailable for a short while. Maintenance does not count as downtime: uptime is measured over one year, and maintenance periods are left out.
A problem that is not listed here? The page shows the state of our systems, not the state of your individual virtual machine. If something does not work for you although everything is green here, get in touch with us.
The “Your connection” test
Below the groups is the Your connection section. It measures in your browser how you reach us. This helps when something feels slow: is it your line or us?
- Click Measure now. The section expands, and the measurement takes a few seconds.
- On the left, under Your endpoint, you see your public IP address (with a copy button), Reverse DNS, Network / ASN – that is, your internet provider –, Prefix, Country (per RIR), Protocol, Browser and the Measurement point.
- On the right, under Connection quality, you see the latency, that is the response time, with a rating: excellent below 25 ms, good below 60 ms, usable below 120 ms, otherwise impaired. Below that come min, max, jitter (variation) and loss.
- Fetch 3 MiB under Throughput gives a rough measure of the transfer speed. Measure again repeats the measurement.
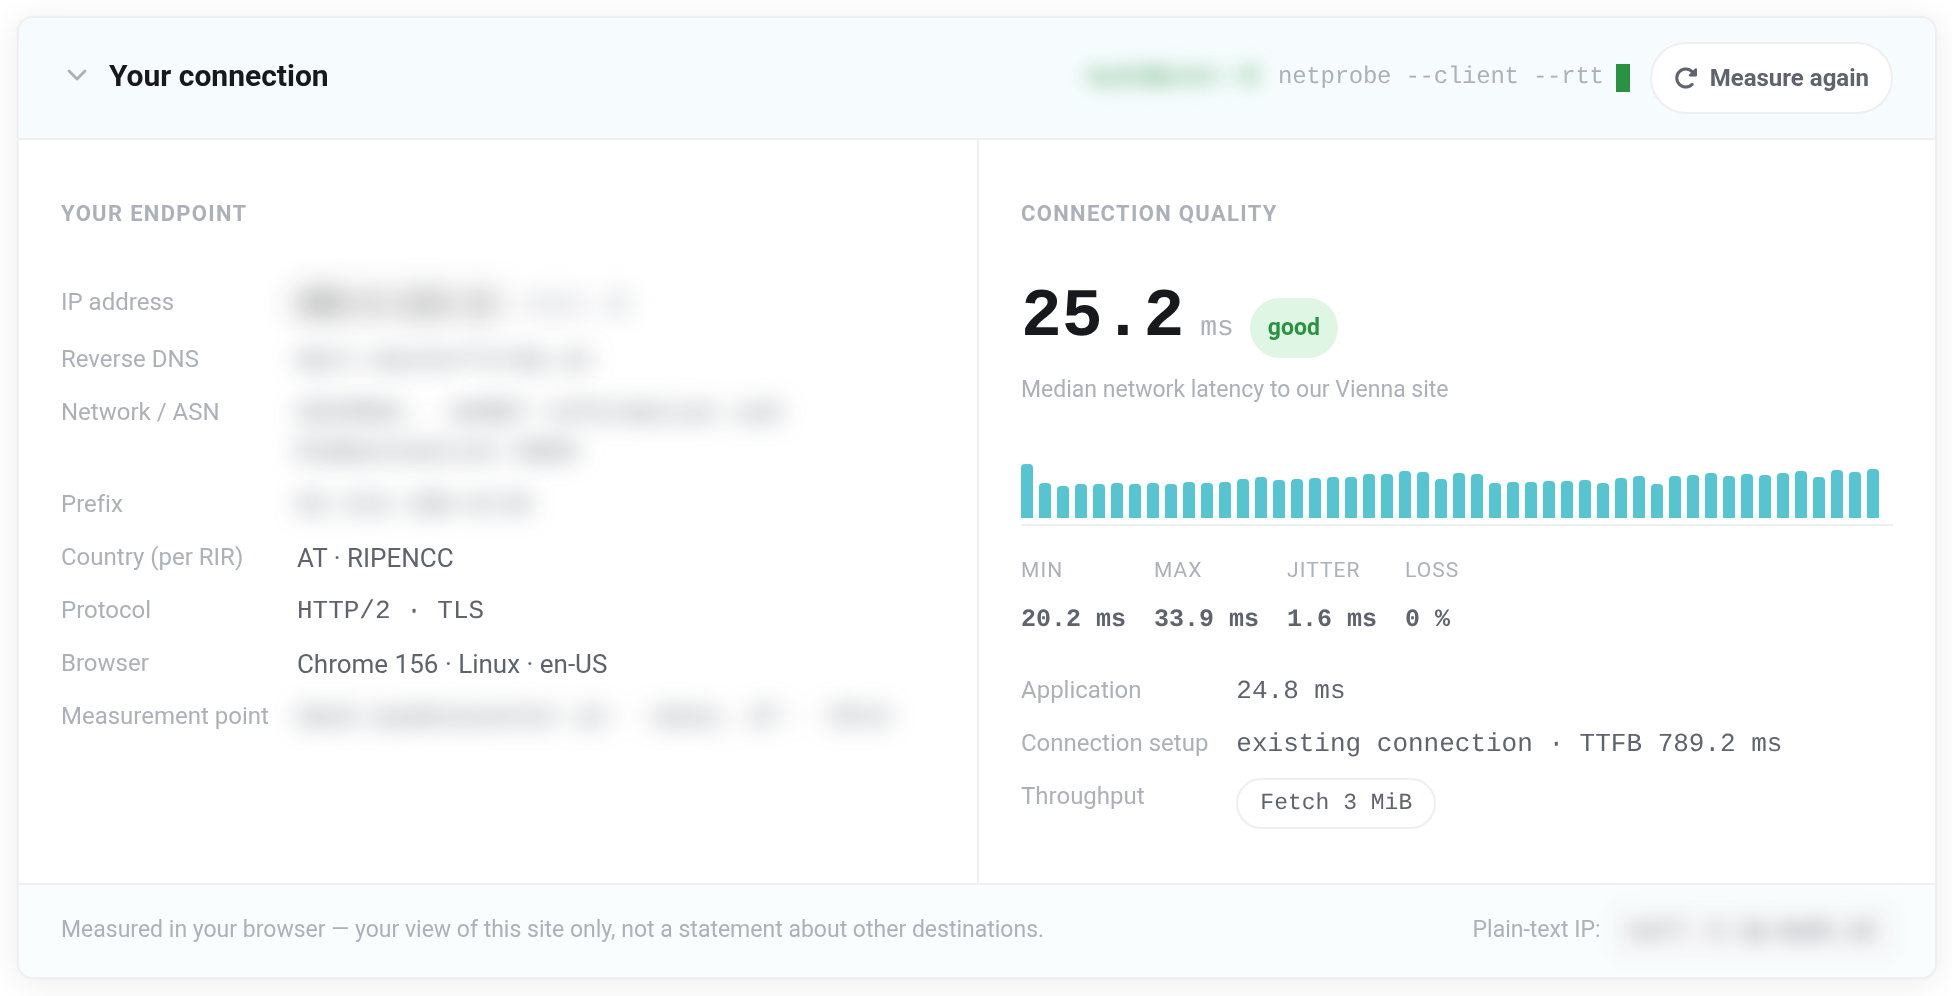
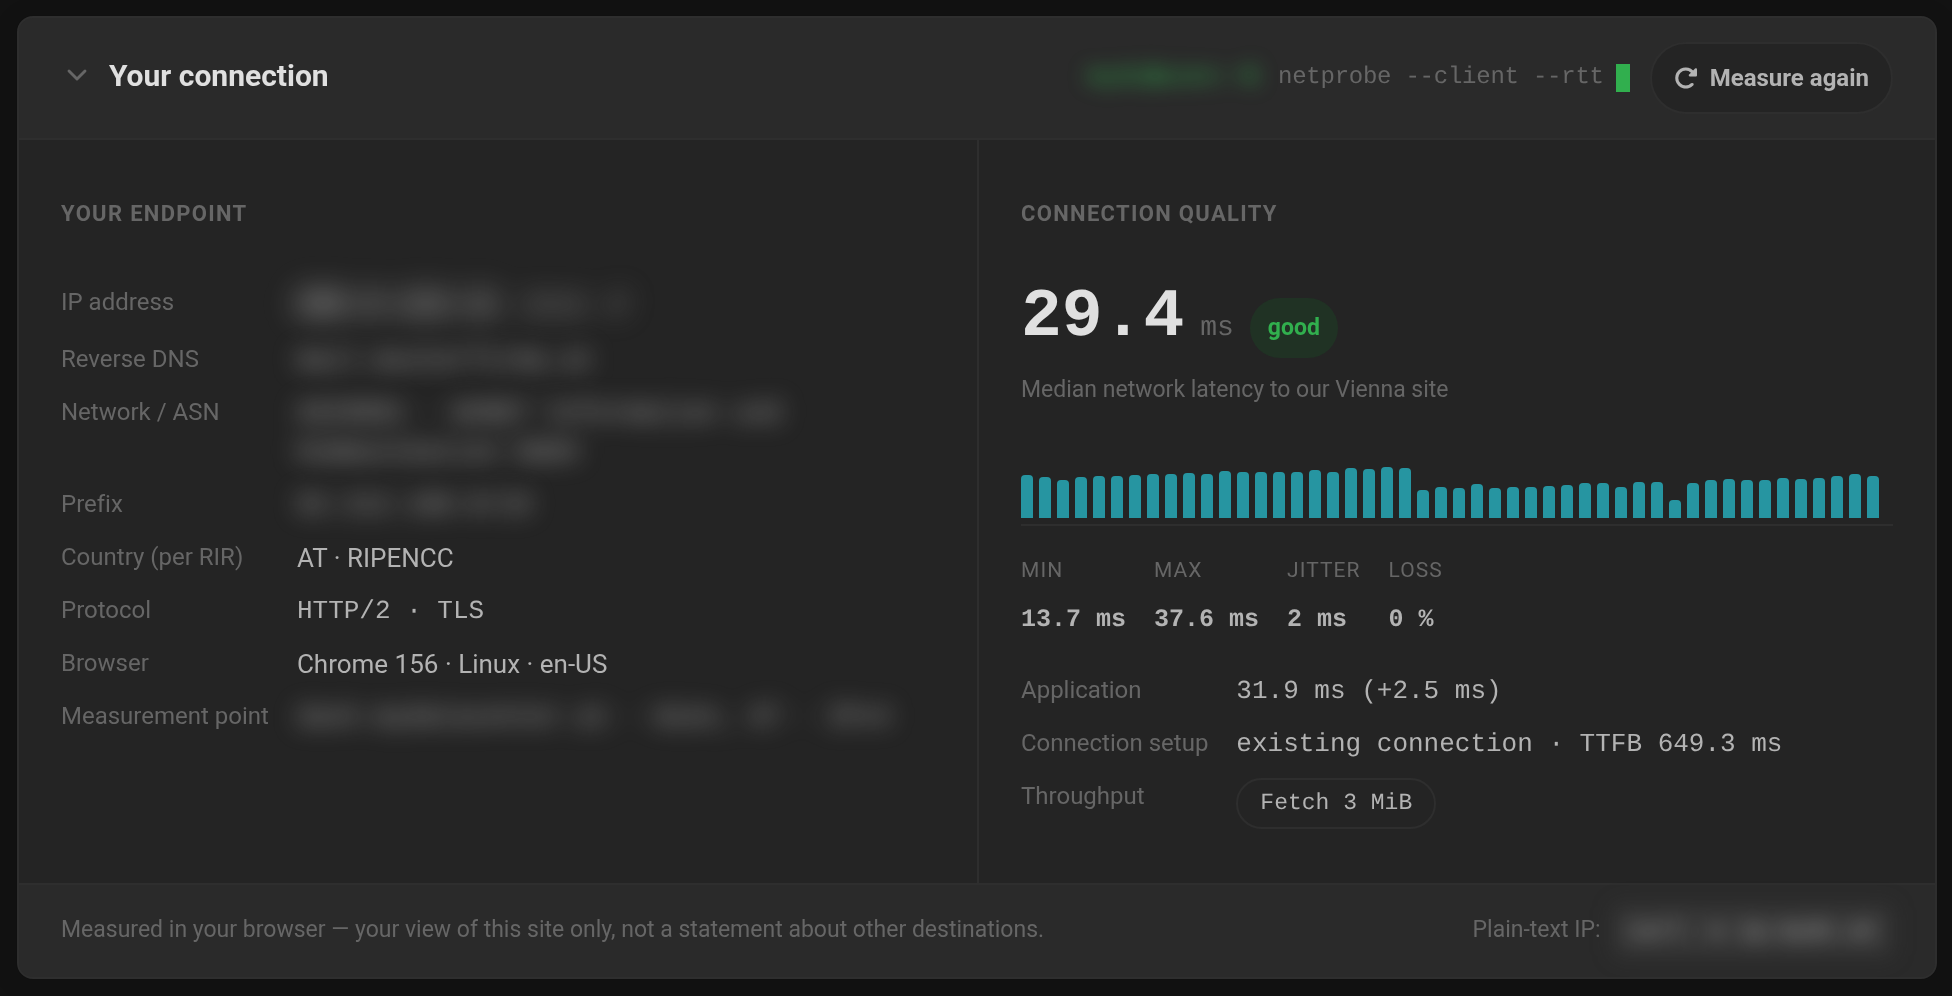 Result of the measurement. The details of the endpoint are blurred in this picture.
Do you need your IP address to allow it in a firewall rule? You can copy it right here.
Only your route to us is measured. The values say nothing about other destinations on the internet. If you have connection problems, send us a screenshot of this section – it saves follow-up questions.


